
- 세상의 모든 계산기 수학, 과학, 공학 이야기 기타 ()
Elo Rating System 이란?
-

- 2017.11.17 - 19:31 2016.03.29 - 13:42 4454 3
1. 정의
승/패로 나뉘는 시합에 있어서, 선수의 실력을 (승/패, 승률에 따라) 점수화하여 순위를 매기는 방식.
https://en.wikipedia.org/wiki/Elo_rating_system
https://namu.wiki/w/Elo%20%EB%A0%88%EC%9D%B4%ED%8C%85
2. 특징
- 이기면 레이팅이 오른다.
레이팅이 자기보다 높은 사람에게 이기면 확 오른다.
레이팅이 자기보다 낮은 사람에게 이기면 조금 오른다. - 지면 레이팅이 떨어진다.
레이팅이 자기보다 높은 사람에게 지면 조금 떨어진다.
레이팅이 자기보다 낮은 사람에게 지면 많이 떨어진다. - 이기고 레이팅이 떨어진다거나, 지고 레이팅이 올라간다거나 하는 일은 절대 없음!
- 레이팅을 기반으로 플레이어간 상대 승률을 추정할 수 있다.
경기 결과에 따른 레이팅 변화
ㄴ Ra : 기존 레이팅
ㄴ K : factor
ㄴ Sa : 실제 획득 점수 (승=1, 무승부=0.5, 패=0)
ㄴ Ea : 기대 획득 점수 (=Elo 기반 승률)


<검은 색 곡선은 y축_좌 승률, 브라운(K=32)과 레드(K=16) 곡선은 y축_우 점수변공>
Graphs of probabilities and Elo rating changes (for K=16 and 32) of expected outcome (solid curve) and unexpected outcome (dotted curve) vs initial rating difference For example, player A starts with a 1400 rating and B with 1800 in a tournament using K = 32 (brown curves). The blue dash-dot line denotes the initial rating difference of 400 (1800 - 1400). The probability of B winning, the expected outcome, is 0.91 (intersection of black solid curve and blue line); if this happens, A's rating decreases by 3 (intersection of brown solid curve and blue line) to 1397 and B's increases by the same amount to 1803. Conversely, the probability of A winning, the unexpected outcome, is 0.09 (intersection of black dotted curve and blue line); if this happens, A's rating increases by 29 (intersection of brown dotted curve and blue line) to 1429 and B's decreases by the same amount to 1771.
- 플레이어 A = 1400, 플레이어 B = 1800, 점수(rating)차이 400.
- K=32 인 것으로 계산시
B가 이기면 Expected 해당 (확률 0.91 = 91%)
A 점수 3점 깍임 = 1400 - 3 = 1397
B 점수 3점 오름 = 1800 + 3 = 1803
A가 이기면 Unexpected 해당 (확률 0.09 = 9%)
A 점수 = 1400 + 29 = 1429
B 점수 = 1800 - 29 = 1771
3. 장/단점
-
25
댓글3
-
세상의모든계산기
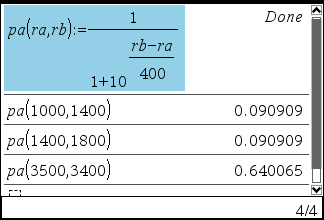
A, B, C 선수만 존재하는 풀을 가정해 보겠습니다.
C는 A와도 경기를 해 보았고, B와도 경기를 해 보았습니다만, A와 B는 지금까지 직접 경기를 해 본 적이 없습니다.- A의 C에 대한 1:1 승률은 99.959278561331%로 ELO Rating 1356점의 차이가 납니다.
- B의 C에 대한 1:1 승률은 91.190530760341%로 ELO Rating 406점의 차이가 납니다.
- A는 B보다 Elo Rating 으로 +950 높으므로 승률이 99.580074308528% 가 될 것으로 추정해 볼 수 있지만,
막상 A vs B 를 1:1로 붙여보면 A의 승률이 80%에 불과합니다.
(B가 A의 특정한 약점을 집요하게 추궁하기 때문이라고 가정해 보겠습니다.)
A, B, C의 Elo Rating 을 각각 4500, 3550, 3144 로 설정해 놓고,
같은 비율로 충분히 많은 시합을 시킬 경우에 각각의 레이팅은 몇점이 될까요? -
1
세상의모든계산기
통계적 접근
- 1라운드당 3경기로 구성하여 각각 1회씩 대결 (순차적)
(기대 승률에 기반하여 Random 하게 승/패 결정. 무승부 없음.) - 매 경기 직후 ELO Rating 변경 (K=16)
- 100 라운드(=300경기) 진행 후 A, B, C 의 Rating 값 저장
- 5000 회 반복하여 통계분석
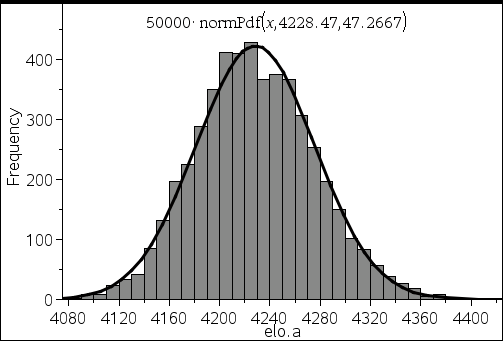
A : 4500에서 4228.47로 (▼271.53)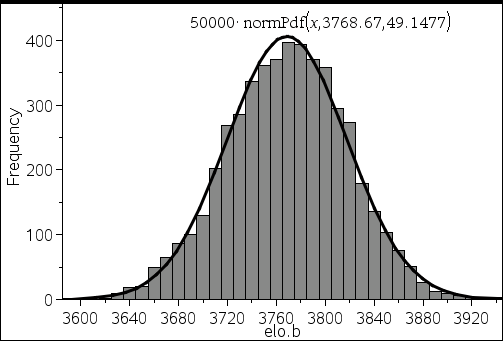
B : 3550에서 3768.67로 (▲218.67)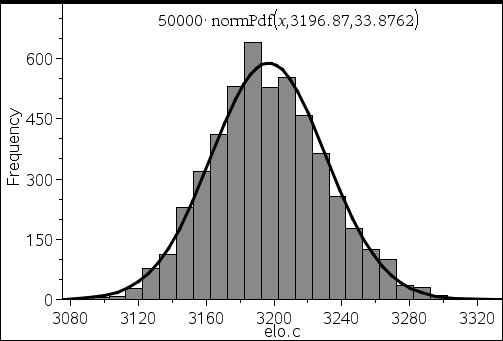
C : 3144에서 3196.87로 (▲52.87)- 조정 전 elo 합계 : 4500 + 3550 + 3144 = 11194
- 조정 후 elo 합계 : 4228.47+3768.67+3196.87 = 11194
- 1라운드당 3경기로 구성하여 각각 1회씩 대결 (순차적)
- 1
세상의모든계산기 님의 최근 댓글
- claude AI는 l-c*r^2 을 1-c*r^2 으로 잘못 읽고 표시하고 있습니다. - TI-nspire CAS 계산기에 l-c*r^2 ≥0 을 조건에 추가해 계산해 보아도 결과는 바뀌지 않습니다. 2026 07.20 ⚠️ 경고가 바로 두 번째 방법이 "성공"한 이유와 정확히 연결되어 있습니다. 경고의 의미 "Domain of the result might be larger than the domain of the input"는 CAS가 절댓값(모듈러스)을 계산하는 과정에서 원래 식보다 정의역이 더 넓은 형태로 단순화했다는 뜻입니다. 구체적으로 이 계산은 내부적으로 대략 이런 과정을 거칩니다. $$\left|\frac{er}{e\cdot r}\right| = \sqrt{\left(\frac{er}{e\cdot r}\right)\cdot\overline{\left(\frac{er}{e\cdot r}\right)}}$$ 즉 원래 식(복소수)과 그 켤레복소수를 곱해서 실수부·허수부 제곱합을 만들고, 거기에 다시 제곱근을 씌우는 과정입니다. 이 과정에서 √(x²) → x 또는 √a·√b → √(ab) 같은 규칙들이 쓰이는데, 이런 규칙들은 x가 실수이고 0 이상일 때만 엄밀하게 성립합니다. CAS는 이 조건들을 일일이 다 추적하지 않고 넘어가면서, 원래는 (e≠0, r+l·ω·i ≠ 0 등) 복소수 특유의 좁은 정의역을 가진 식을, r, l, ω가 어떤 실수여도(부호 무관하게) 정의되는 1/√(r²+l²·ω²)라는 더 넓은 정의역의 식으로 바꿔버린 것입니다. CAS는 이 손실을 감지하고 경고를 띄운 것입니다. 이게 왜 조건 대입 성공과 연결되는가 정리하면, 이 경고는 사실상 이런 뜻입니다. "나는 이 결과를 만들면서 원래 식이 가지고 있던 정의역 제약 정보(부호 조건, i 관련 조건 등)를 이미 버렸다." 바로 이 "정의역 정보를 버린" 상태가 이후 con_1 대입을 매끄럽게 만드는 원인입니다. 첫 번째 시도에서는 i가 살아있는 원래 식에 조건을 대입했기 때문에, CAS가 √(1-c·r²)이 실수인지(정의역 조건: 1-c·r² ≥ 0) 계속 추적하려고 했고, 그 정보가 con에 없어서 더 이상 정리를 못 하고 멈췄습니다. 두 번째 시도에서는 절댓값 계산 단계에서 이미 그런 세밀한 정의역 추적을 CAS 스스로 포기(단순화)했기 때문에, 이후 ω에 무리식을 대입해도 "이게 실수가 맞나?" 하는 검증 절차 없이 그냥 대수적으로 치환·정리해 버립니다. 그래서 깔끔하게 √c/√l이 나온 겁니다. 한 줄 요약 절댓값 계산 시 뜬 "정의역이 넓어졌을 수 있다"는 경고는, CAS가 그 순간에 원래 식의 엄밀한 조건(정의역)을 놓쳤다는 신호이고, 바로 그 "조건을 놓친 상태"이기 때문에 뒤에 이어지는 조건식 대입이 막힘없이 진행된 것입니다. 다만 그 대가로, 결과인 1/√(r²+l²·ω²)이나 최종 √c/√l이 원래 회로 조건(i≠0이 되는 경계, 분모가 0이 되는 경우 등)에서는 엄밀히 성립하지 않을 수 있다는 점은 감안하셔야 합니다. 실제 물리적으로는 r, l, c > 0이고 결과도 물리적으로 타당한 형태라 문제없어 보이지만, 수학적 엄밀성 측면에서는 "정의역이 넓어진 근사적 결과"라는 꼬리표가 붙어있는 셈입니다. 2026 07.20 Claude AI 답변 TI-Nspire CAS의 | (such that / 조건대입) 연산자는 대입 시점의 수식 형태를 그대로 두고 기호만 치환하는 연산입니다. 대입 후에 처음부터 다시 "실수부/허수부 분리, 유리화" 같은 재간소화를 자동으로 수행하지 않습니다. 이 차이가 지금 보신 결과 차이의 핵심입니다. 첫 번째 경우 (|er/(e·r)| | con_1 and con → 실패) 이 시점의 식은 아직 r + l·ω·i 형태의 복소수 그대로입니다 (i가 살아있음). 여기에 con_1: ω = √(1-c·r²)/(√c·l)을 대입하면, 분모 안에 i · √(1-c·r²) 라는 항이 새로 생깁니다. 문제는 CAS가 √(1-c·r²)이 실수인지(즉 1-c·r² ≥ 0인지) 판단할 근거가 없다는 겁니다. 저장해 두신 con 조건은 c>0, l>0, r>0뿐이고, 1-c·r²≥0이라는 조건은 포함되어 있지 않습니다. 그래서 CAS는 i와 이 무리식을 더 정리(유리화, 실수부·허수부 재결합)하지 못하고 있는 그대로 남겨둡니다. 결과에 여전히 i가 보이는 이유입니다. 두 번째 경우 (결과값 1/√(r²+l²·ω²)에 대입 → 성공) |er/(e·r)| (절댓값/모듈러스) 연산은 그 자체로 이미 "복소수 → 실수" 변환을 완료한 결과입니다. 즉 1/√(r²+l²·ω²)에는 더 이상 i가 없고, 순수하게 r, l, ω로만 이루어진 실수식입니다. 이 식에 ω = con_1을 대입하는 것은 그냥 실수 대수식에 실수 대입하는 것이므로, i와 무리식이 뒤엉키는 문제 자체가 발생하지 않습니다. 그래서 바로 깔끔하게 √c/√l로 정리됩니다. 정리하면 절댓값(모듈러스) 계산은 "이 값들이 실수다"라는 가정을 이미 내부적으로 써서 i를 제거하는 연산입니다. 그 연산을 조건 대입 이전에 해두면, 이후 대입은 단순 실수 대입이라 문제없이 정리됩니다. 반대로 i가 남아있는 식에 무리식을 포함한 조건을 먼저 대입하면, 그 무리식의 실수성/부호에 대한 가정이 없어서 CAS가 i를 소거하는 재간소화를 못 하고 멈춰버립니다. 실용적 팁: 복소식에 조건을 대입해야 할 때는 가능하면 절댓값·실수화(유리화) 등을 먼저 끝내서 i를 없앤 뒤 조건을 대입하거나, 대입 후 결과에 다시 simplify/expand/combine 같은 명령을 한 번 더 걸어주면 (필요한 도메인 조건과 함께) 정리가 되는 경우가 많습니다. 2026 07.19 저도 어림잡아 추측할 뿐이지 정확한 이유를 알지는 못합니다. 질문하신 사진을 그대로 (Gemini 3.5 Flash / ChatGPT / Claude Sonnet 5) AI에 넣어 보니 claude AI 가 제일 합리적인 답변을 주어서 이를 붙여 넣습니다. 2026 07.19 아 그렇네요. 감사합니다. ^^ 2026 04.28